We recently released a new add-on for WP Store Locator that allows you to track search data and stay informed about your customer base.
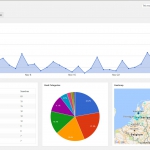
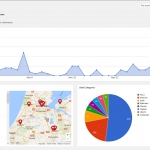
The Statistics add-on provides a single place to keep track of which current stores and which potential store locations receive the most search traffic. Whether you are looking to maximize efficiency or expand to new locations, this data allows you to make well-informed decisions.
How Does it Work?
Using the add-on’s analytics, you can view details about which store locations get the most traffic and adjust store inventory to match the demand.
Additionally, the Statistics add-on keeps track of all the locations that are searched for, even when there is no store there. This means that if you are looking to expand your business, you will know the exact locations that will be the most popular with your customers.
Lastly, this add-on provides you with an analysis of the most searched-for product categories. Represented in a pie chart, you can continually keep tabs on which kinds of products are the most popular and know when to expect an influx in demand for a certain type of product.
What Does it Look Like?
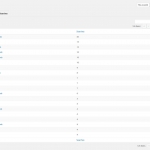
The analytics are presented in various easy-to-understand formats, including list, line graph, heat map, and pie chart.
Click on the images below to see an example of the Statistics add-on.